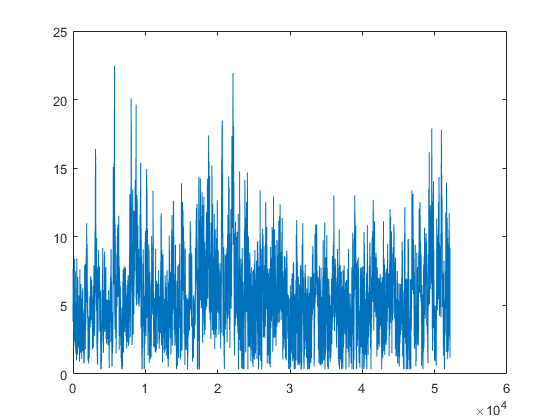
dw=xlsread('sotaventogaliciaanual.xlsx');
nbins=linspace(0,25,25);
plot(dw)
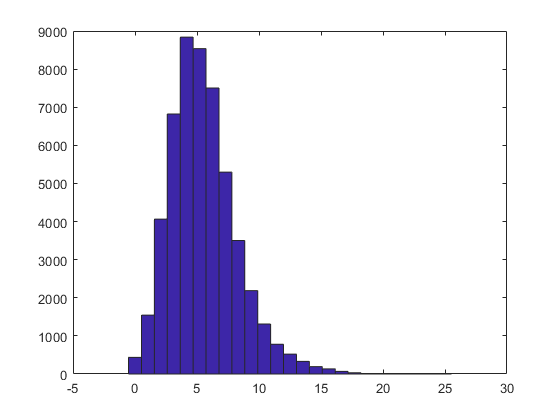
figure;
hist(dw,nbins)
Published with MATLAB® R2019b